DeepMind x UCL RL Lecture 2 – Solutions

This post is a little bit niche, given that it’s addressed to people who may have seen the DeepMind x UCL Lecture Series on Reinforcement Learning and were wondering how the answers to the end-of-lecture questions were worked out. It took me a fair while to figure them out myself; it’s been a long time since I’ve needed to use integral calculus. But it may be useful for someone, so here it is.

Introduction

There’s a great series of lectures on Reinforcement Learning available on YouTube, a collaboration between Google DeepMind and the UCL Centre for Artificial Intelligence. The first lecture is a broad overview of the topic, introducing the core concepts of Agents, States, Policy, Value Functions and so on. The second lecture picks up from this and starts going into the mathematics behind some of the action selection Policy algorithms. This lecture concludes with an exercise to demonstrate worked examples of these policies in action on a very simple problem.

Policy Example Question

The example question appears close to the end of the video (at timestamp 2:03:45). We are given two actions (a and b) so that at time step 1, action a is selected and we observe a reward of 0. At time step 2, action b is selected and we observe a reward of +1.

The question to answer is what is the probability that we will select action a under the different selection algorithms, i.e.

P(A_{3} = a)

Greedy Policy

This selection policy is very simple. The action selected is the one that has the highest Action Value (Q) observed to date:

A_{t}=argmax_{x \in A}~Q_{t}(x)

Where:

~Q_{t}(x)=\frac{\sum_{n=1}^t~I(A_{n}=x)R_{n}}{\sum_{n=1}^t~I(A_{n}=x)}

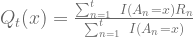
The function I indicates if the action has been chosen at the particular time (it’s an Indicator function) and the function R is the observed reward.

So for action a, ~Q_{t}(a) = \frac{(1\times0)+(0\times0)}{1}=\frac{0}{1}=0

For action b, Q_{t}(b) = \frac{(0\times0)+(1\times1)}{1}=\frac{1}{1}=1

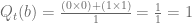
Therefore, action a will not be selected by the Greedy Policy, p(A_{3}=a) = 0.

\epsilon-Greedy Policy

The \epsilon-Greedy Policy introduces a random element in to the selection to avoid getting stuck like the Greedy Policy.

With the probability p(1-\epsilon), behave like the Greedy Policy. In this case, action b would be selected.

With probability p(\epsilon), select an action at random. In this problem there are two actions so they have a equal probability of being select. So select either a with p(a) = 0.5 or select b p(b) = 0.5.

So to work out what the probability of selecting action a is, we’ll combine the two probabilities:

p(A_{3}=a) = p(a) \times p(\epsilon) = 0.5p(\epsilon) = \frac{p(\epsilon)}{2}

Upper Confidence Bounds (UCB) Policy

UCB is an interesting policy that tries to balance the exploration/exploitation trade off via the hyperparamter C. If C is set to 0, then you have a greedy policy. As C increases, you are giving more opportunity to exploration, in other words, selecting alternative actions.

action_{t} = argmax_{x \in A} ~Q_{t}(x)+U_{t}(x), where U_{t}(x)=c~\sqrt[]{\frac{ln(t)}{n_{t}(x)}}

Both a and b have the same U_{t}(x) for any value of C we select, since both actions have been selected once (the nt(x) part of the function counts the number of times the action x has been chosen). Therefore, in this particular problem, UCB behaves the same as the greedy policy.

\Rightarrow~argmax_{x \in A} Q_{t}(x)+~c~\sqrt[]{\frac{ln(t)}{1}}

As before, ~b will be selected, so p(A_{3}=a) = 0

Thompson Sampling

A probability matching policy selects an action based on the probability that it is the best action. Thompson Sampling does this by calculating a probability of the expected reward for each action, and then selecting the action that has the maximum.

This question posed a bit of difficulty. There is an error in the video presentation at time 1:47:50, which caused me a bit of confusion. At that point, the procedure for updating the posterior for the beta distribution Beta(xa,ya) is introduced, but it is incorrect. The posterior updates are swapped around. The correct update should be:

x_{A_{t}} \leftarrow x_{A_{t}} + 1 , when Rt = 1 (action chosen, reward observed)

y_{A_{t}} \leftarrow y_{A_{t}} + 1 , when Rt = 0 (action chosen, no reward observed)

Therfore, the values of \alpha and \beta for the prior actions selected are:

Action aAction b
t=0\alpha=1,~\beta=1\alpha=1,~\beta=1
t=1\alpha=1, ~\beta=2\alpha=1,~\beta=1
t=2\alpha=1,~ \beta=2\alpha=2,~\beta=1

The values of \alpha and \beta at time t=2 give the following Beta probability distributions for action a and action b.

Plot showing the Beta Probability Distribution for action a, where the probability density at 0 is 2, and the density at 1 is 0. The distribution of the probability descends in a straight line between these two extremes.
Plot showing the Beta Probability Distribution for action b, where the probability density at 0 is 0, and the density at 1 is 2. The distribution of the probability ascends in a straight line between these two extremes.

For completion, the expected values of these distributions are:

\mathbb{E}[x] = \mu = \frac{\alpha}{\alpha + \beta}

For Action a, this is 1/3 and for Action b, this is 2/3.

Let’s look at the Probability Density Functions for each of the actions. The standard Beta Distribution is given by:

\frac{1}{B(\alpha,\beta)}[{x}^{\alpha-1}{(1-x)}^{\beta-1}]

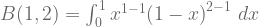
In particular, the beta function itself, “B” (the denominator of the fraction in that equation) is expressed by:

B(\alpha,\beta)=\int_{0}^{1} {x}^{\alpha-1}{(1-x)}^{\beta-1} ~dx

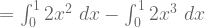
For action “a”, the value of the Beta function is:

B(1,2) = \int_{0}^{1} {x}^{1-1}{(1-x)}^{2-1} ~dx

= \int_{0}^{1} 1(1-x)~dx

= \int_{0}^{1} 1-x ~dx

= \large[x-\frac{x^{2}}{2}\large]_{0}^{1}

= \large[1-\frac{1^{2}}{2}\large]-\large[0-\frac{0^{2}}{2}\large] = \frac{1}{2}

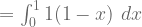
For action “b”, the value of the Beta function is:

B(2,1) = \int_{0}^{1} {x}^{2-1}{(1-x)}^{1-1} ~dx

= \int_{0}^{1} x~dx

= \large[\frac{x^{2}}{2}\large]_{0}^{1}

= \large[\frac{1^{2}}{2}\large] - \large[\frac{0^{2}}{2}\large] = \frac{1}{2}

Now we can calculate the Probability Density Functions for both actions:

PDF for action a:

\frac{1}{\frac{1}{2}}(x^{1-1}(1-x)^{2-1})

= 2(1-x) = 2-2x

PDF for action b (using y instead of x as the random variable):

\frac{1}{\frac{1}{2}}(y^{2-1}(1-y)^{1-1})

= 2y

The joint PDF for the actions is given by:

(2-2x)2y

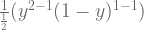
Now that we have the joint probability for the actions, we can calculate the probability that the next action selected will be action “a” as follows:

= \int_{0}^{1}\int_{0}^{x} (2-2x)2y ~dy ~dx

= \int_{0}^{1} \large(\large[(2-2x)y^{2}\large]_{0}^{x}) ~dx

= \int_{0}^{1} \large(\large[(2-2x)x^{2}\large] - \large[(2-2x)0^{2}\large]\large) ~dx

= \int_{0}^{1} (2-2x)x^{2} ~dx

= \int_{0}^{1} 2x^{2} - 2x^{3} ~dx

= \int_{0}^{1} 2x^{2} ~dx - \int_{0}^{1} 2x^{3} ~dx

= 2\int_{0}^{1} x^{2} ~dx - 2\int_{0}^{1} x^{3} ~dx

= \large[\frac{2x^{3}}{3} - \frac{2x^{4}}{4}\large]_{0}^{1}

= \large[\frac{2(1)^{3}}{3} - \frac{2(1)^{4}}{4}\large] - \large[\frac{2(0)^{3}}{3} - \frac{2(0)^{4}}{4}\large]

= \frac{2}{3} - \frac{2}{4}

= \frac{2}{3} - \frac{1}{2}

= \frac{4-3}{6}

= \frac{1}{6}

So using Thompson Sampling, the probability of selecting action a is: p(A_{3}=a) = \frac{1}{6}

Note that in the video, the answer is given as 1/4. This is corrected later in the comments.

Conclusion

Hopefully, you found these answers and explanations useful. If so, please let me know in the comments below. Please also let me know if you find any errors and I’ll gladly correct them.
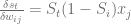
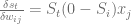
Solving MNIST with a Neural Network from the ground up

Note: Here’s the Python source code for this project in a Jupyter notebook on GitHub

I’ve written before about the benefits of reinventing the wheel and this is one of those occasions where it was definitely worth the effort. Sometimes, there is just no substitute for trying to implement an algorithm to really understand what’s going on under the hood. This is especially true when learning about artificial neural networks. Sure, there are plenty of frameworks available that you can use which implement any flavour of neural network, complete with a dazzling arrays of optimisations, activations and loss functions. That may solve your problem, but it abstracts away a lot of the details about why it solves it.

MNIST is a great dataset to start with. It’s a collection of images containing 60,000 handwritten digits. It also contains a further 10,000 images that can be used as the test set. It’s been well studied and most frameworks have sample implementations. Here’s an example image:

You can find the full dataset of images on Yann Le Cun’s website.

While it’s useful to reinvent the wheel, we should at least learn from those that have already built wheels before. The first thing I borrowed was the network architecture from TensorFlow. Their example has:

  • 28×28 input
  • a hidden layer with 512 neurons with ReLU activation
  • an output layer with 10 neutrons (representing the 10 possible digits) with Softmax activation
  • Cross-Entropy loss function

The next thing to work on was the feedforward part of the network. This is relatively straightforward as these functions are well documented online and the network itself isn’t complicated.

The tough part was working through the back-propagation algorithm. In a previous post, I detailed how to work out the derivatives of the Softmax function and the Cross Entropy loss. The most obvious way is to use the Chain Rule in Differential Calculus to work out the gradients and propagate them back through the network. The steps are pleasing to my eye and appeal to my sense of order in code. (Tip: Use a spreadsheet on a small example network to see the actual matrices in action.)

But (and it’s a big but), the basic approach uses Jacobian matrices. Each cell in these kind of matrices is a partial derivative; each matrix represents a change in every variable with respect to every output. As a result, they can grow rather large very quickly. We run into several issues multiplying very large matrices together. In the notebook, I’ve left the functions representing this approach in for comparison and if you do run it, you’ll notice immediately the problems with speed and memory.

Luckily there are shortcuts, which mean that we can directly calculate the gradients without resorting to Jacobian matrix multiplication. You can see these in the Short Form section of the notebook. In a sense though, these are abstractions too and it’s difficult to see the back-propagation from the shortcut methods.

Lastly, I’ve implemented some code to gather the standard metrics for evaluating how good a machine learning model is. I’ve run it several times and it usually gets an overall accuracy score of between 92% and 95% on the MNIST test dataset.

One of the main things I learned from this exercise is that the actual coding of a network is relatively simple. The really hard part that took a while was figuring out the calculus and especially the shortcuts. I really appreciate now why those frameworks are popular and make coding neural networks so much easier.

If you fancy a challenge, I can recommend working on a neural network from first principles. You never know what you might learn!

The Softmax Function Derivative (Part 3)

Previously I’ve shown how to work out the derivative of the Softmax Function combined with the summation function, typical in artificial neural networks.

In this final part, we’ll look at how the weights in a Softmax layer change in respect to a Loss Function. The Loss Function is a measure of how “bad” the estimate from the network is. We’ll then be modifying the weights in the network in order to improve the “Loss”, i.e. make it less bad.

The Python code is based on the excellent article by Eli Bendersky which can be found here.

Cross Entropy Loss Function

There are different kinds Cross Entropy functions depending on what kind of classification that you want your network to estimate. In this example, we’re going to use the Categorical Cross Entropy. This function is typically used when the network is required to estimate which class something belongs to, when there are many classes. The output of the Softmax Function is a vector of probabilities, each element represents the network’s estimate that the input is in that class. For example:

[0.19091352 0.20353145 0.21698333 0.23132428 0.15724743]

The first element, 0.19091352, represents the network’s estimate that the input is in the first class, and so on.

Usually, the input is in one class, and we can represent the correct class for an input as a one-hot vector. In other words, the class vector is all zeros, except for a 1 in the index corresponding to the class.

[0 0 1 0 0]

In this example, the input is in class 3, represented by a 1 in the third element.

The multi-class Cross Entropy Function is defined as follows:

-\sum_{c=1}^M=y_{o,c} \textup{ log}(S_{o,c})

where M is the number of classes, y is the one-hot vector representing the correct classification c for the observation o (i.e. the input). S is the Softmax output for the class c for the observation o. Here is some code to calculate that (which continues from my previous posts on this topic):

def x_entropy(y, S):
    return np.sum(-1 * y * np.log(S))

y = np.zeros(5)
y[2] = 1   # picking the third class for example purposes
xe = x_entropy(y, S)
print(xe)

1.5279347484961026

Cross Entropy Derivative

Just like the other derivatives we’ve looked at before, the Cross-Entropy derivative is a vector of partial derivatives with respect to it’s input:

\frac{\Delta XE}{\Delta S} = \left[  \frac{\delta XE}{\delta S_{1}} \frac{\delta XE}{\delta S_{2}} \ldots \frac{\delta XE}{\delta S_{t}}  \right]

We can make this a little simpler by observing that since Y (i.e. the ground truth classification vector) is zeros, except for the target class, c, then the Cross Entropy derivative vector is also going to be zeros, except for the class c.

To see why this is the case, let’s examine the Cross Entropy function itself. We calculate it by summing up a product. Each product is the value from Y multiplied by the log of the corresponding value from S. Since all the elements in Y are actually 0 (except for the target class, c), then the corresponding derivative will also be 0. No matter how much we change the values in S, the result will still be 0.

Therefore:

\frac{\Delta XE}{\Delta S} = \left[ \ldots \frac{\delta XE}{\delta S_{t}} \ldots \right]

We can rewrite this a little, expanding out the XE function:

\frac{\Delta XE}{\Delta S} = \left[ \ldots \frac{\delta -(Y_{c}\textup{log}(S_{c}))}{\delta S_{c}} \ldots \right]

We already know that Y_{c} is 1, so we are left with:

\frac{\Delta XE}{\Delta S} = \left[ \ldots \frac{\delta -\textup{log}(S_{c})}{\delta S_{c}} \ldots \right]

So we are just looking for the derivative of the log of S_{c}:

\frac{\Delta XE}{\Delta S} = \left[ \ldots -\frac{1}{S_{c}} \ldots \right]

The rest of the elements in the vector will be 0. Here is the code that works that out:

def xe_dir(y, S):
    return (-1 / S) * y

DXE = xe_dir(y, S)
print(DXE)

[-0.      -0.      -4.60864 -0.      -0.     ]

Bringing it all together

When we have a neural network layer, we want to change the weights in order to make the loss as small as possible. So we are trying to calculate:

\frac{\Delta XE}{\Delta W}

for each of the input instances X. Since XE is a function that depends on the Softmax function, which itself depends on the summation function in the neurons, we can use the calculus chain rule as follows:

\frac{\Delta XE}{\Delta W} = \frac{\Delta XE}{\Delta S} \cdot \frac{\Delta S}{\Delta Z} \cdot \frac{\Delta Z}{\Delta W}

In this post, we’ve calculated \frac{\Delta XE}{\Delta S} and in the previous posts, we calculated \frac{\Delta S}{\Delta Z} and \frac{\Delta Z}{\Delta W}. To calculate the overall changes to the weights, we simply carry out a dot product of all those matrices:

print(np.dot(DXE, DL_shortcut).reshape(W.shape))

[[ 0.01909135  0.09545676  0.07636541  0.02035314  0.10176572]
 [ 0.08141258 -0.07830167 -0.39150833 -0.31320667  0.02313243]
 [ 0.11566214  0.09252971  0.01572474  0.07862371  0.06289897]]

Shortcut

Now that we’ve seen how to calculate the individual parts of the derivative, we can now look to see if there is a shortcut that avoids all that matrix multiplication, especially since there are lots of zeros in the elements.

Previously, we had established that the elements in the matrix \frac{\Delta S}{\Delta W} can be calculated using:

\frac{\delta{S_{t}}}{\delta{W_{ij}}} = S_{t}(1-S_{i})x_{j}

where the input and output indices are the same, and

\frac{\delta{S_{t}}}{\delta{W_{ij}}} = S_{t}(0-S_{i})x_{j}

where they are different.

Using this result, we can see that an element in the derivative of the Cross Entropy function XE, with respect to the weights W is (swapping c for t):

\frac{\delta{XE_{c}}}{\delta{W_{ij}}} = \frac{\delta{XE_{c}}}{\delta{S_{c}}} \cdot S_{c}(1-S_{i})x_{j}

We’ve shown above that the derivative of XE with respect to S is just -\frac{1}{S_{c}}. So each element in the derivative where i = c becomes:

\frac{\delta{XE_{c}}}{\delta{W_{ij}}} = -\frac{1}{S_{c}} \cdot S_{c}(1-S_{i})x_{j}

This simplifies to:

\frac{\delta{XE_{c}}}{\delta{W_{ij}}} = (S_{i}-1)x_{j}

Similarly, where i <> c:

\frac{\delta{XE_{c}}}{\delta{W_{ij}}} = (S_{i})x_{j}

Here is the corresponding Python code for that:

def xe_dir_shortcut(W, S, x, y):
    dir_matrix = np.zeros((W.shape[0] * W.shape[1]))
    
    for i in range(0, W.shape[1]):
        for j in range(0, W.shape[0]):
            dir_matrix[(i*W.shape[0]) + j] = (S[i] - y[i]) * x[j]
                
    return dir_matrix

delta_w = xe_dir_shortcut(W, h, x, y)

Let’s verify that this gives us the same results as the longer matrix multiplication above:

print(delta_w.reshape(W.shape))

[[ 0.01909135  0.09545676  0.07636541  0.02035314  0.10176572]
 [ 0.08141258 -0.07830167 -0.39150833 -0.31320667  0.02313243]
 [ 0.11566214  0.09252971  0.01572474  0.07862371  0.06289897]]

Now we have a simple function that will calculate the changes to the weights for a seemingly complicated single-layer of a neural network.

The Softmax Function Derivative (Part 2)

In a previous post, I showed how to calculate the derivative of the Softmax function. This function is widely used in Artificial Neural Networks, typically in final layer in order to estimate the probability that the network’s input is in one of a number of classes.

In this post, I’ll show how to calculate the derivative of the whole Softmax Layer rather than just the function itself.

The Python code is based on the excellent article by Eli Bendersky which can be found here.

The Softmax Layer

A Softmax Layer in an Artificial Neural Network is typically composed of two functions. The first is the usual sum of all the weighted inputs to the layer. The output of this is then fed into the Softmax function which will output the probability distribution across the classes we are trying to predict. Here’s an example with three inputs and five classes:

For a given output zi, the calculation is very straightforward:

z_{i}=w_{i1}x_{1}+w_{i2}x_{2}+...+w_{in}x_{n}

We simply multiply each input to the node by it’s corresponding weight. Expressing this in vector notation gives us the familiar:

\textbf{z}=\textbf{w}^{\textbf{T}}\textbf{x}

The vector w is two dimensional so it’s actually a matrix and we can visualise the formula for our example as follows:

I’ve already covered the Softmax Function itself in the previous post, so I’ll just repeat it here for completeness:

\sigma(z_{i})=\frac{e^{z_{i}}} {\sum_{j=1}^K e^{z_{j}}}

Here’s the python code for that:

import numpy as np

# input vector
x = np.array([0.1,0.5,0.4])

# using some hard coded values for the weights
# rather than random numbers to illustrate how 
# it works
W = np.array([[0.1, 0.2, 0.3, 0.4, 0.5],
             [0.6, 0.7, 0.8, 0.9, 0.1],
             [0.11, 0.12, 0.13, 0.14, 0.15]])

# Softmax function
def softmax(Z):
    eZ = np.exp(Z)
    sm = eZ / np.sum(eZ)
    return sm

Z = np.dot(np.transpose(W), x)
h = softmax(Z)
print(h)

Which should give us the output h (the hypothesis):

[0.19091352 0.20353145 0.21698333 0.23132428 0.15724743]

Calculating the Derivative

The Softmax layer is a combination of two functions, the summation followed by the Softmax function itself. Mathematically, this is usually written as:

h = S(Z(x))

The next thing to note is that we will be trying to calculate the change in the hypothesis h with respect to changes in the weights, not the inputs. The overall derivative of the layer that we are looking for is:

h' =  \frac{d\textbf{S}}{d\textbf{w}}

We can use the differential chain rule to calculate the derivative of the layer as follows:

\frac{d\textbf{S}}{d\textbf{w}} = \frac{d\textbf{S}}{d\textbf{Z}} \cdot  \frac{d\textbf{Z}}{d\textbf{w}}

In the previous post, I showed how to work out dS/dZ and just for completeness, here is a short Python function to carry out the calculation:

def sm_dir(S):
    S_vector = S.reshape(S.shape[0],1)
    S_matrix = np.tile(S_vector,S.shape[0])
    S_dir = np.diag(S) - (S_matrix * np.transpose(S_matrix))
    return S_dir

DS = sm_dir(h)
print(DS)

The output of that function is a matrix as follows:

[[ 0.154465 -0.038856 -0.041425 -0.044162 -0.030020]
 [-0.038856  0.162106 -0.044162 -0.047081 -0.032004]
 [-0.041425 -0.044162 0.1699015 -0.050193 -0.034120]
 [-0.044162 -0.047081 -0.050193  0.177813 -0.036375]
 [-0.030020 -0.032004 -0.034120 -0.036375  0.132520]]

Derivative of Z

Let’s next look at the derivative of the function Z() with respect to W, dZ/dW. We are trying to find the change in each of the elements of Z(), zk when each of the weights wij are changed.

So right away, we are going to need a matrix to hold all of those values. Let’s assume that the output vector of Z() has K elements. There are (i \cdot j) individual weights in W. Therefore, our matrix of derivatives is going to be of dimensions (K, (i \cdot j)). Each of the elements of the matrix will be a partial derivative of the output zk with respect to the particular weight wij:

\frac{\delta{S}}{\delta{x}} = \left [ \begin{array}{ccc} \frac{\delta{z_{1}}}{\delta{w_{11}}} & \ldots & \frac{\delta{z_{1}}} {\delta{w_{53}}} \\  \ldots & \frac{\delta{z_{k}}}{\delta{w_{ij}}} & \ldots \\ \frac{\delta{z_{K}}}{\delta{w_{11}}} & \ldots & \frac{\delta{z_{K}}} {\delta{w_{53}}} \end{array} \right ]

Taking one of those elements, using our example above, we can see how to work out the derivative:

z_{1} = w_{11}x_{1} + w_{12}x_{2} + w_{13}x_{3}

None of the other weights are used in z1. The partial derivative of z1 with respect to w11 is x1. Likewise, the partial derivative of z1 with respect to w12 is x2, and with respect to w13 is x3. The derivative of z1 with respect to the rest of the weights is 0.

This makes the whole matrix rather simple to derive, since it is mostly zeros. Where the elements are not zero (i.e. where i = k), then the value is xj. Here is the corresponding Python code to calculate that matrix.

# derivative of the Summation Function Z w.r.t weight matrix W given inputs x

def z_dir(Z, W, x):
    dir_matrix = np.zeros((W.shape[0] * W.shape[1], Z.shape[0]))
    
    for k in range(0, Z.shape[0]):
        for i in range(0, W.shape[1]):
            for j in range(0, W.shape[0]):
                if i == k:
                    dir_matrix[(i*W.shape[0]) + j][k] = x[j]
    
    return dir_matrix

If we use the example above, then the derivative matrix will look like this:

DZ = z_dir(Z, W, x)
print(DZ)

[[0.1 0.  0.  0.  0. ]
 [0.5 0.  0.  0.  0. ]
 [0.4 0.  0.  0.  0. ]
 [0.  0.1 0.  0.  0. ]
 [0.  0.5 0.  0.  0. ]
 [0.  0.4 0.  0.  0. ]
 [0.  0.  0.1 0.  0. ]
 [0.  0.  0.5 0.  0. ]
 [0.  0.  0.4 0.  0. ]
 [0.  0.  0.  0.1 0. ]
 [0.  0.  0.  0.5 0. ]
 [0.  0.  0.  0.4 0. ]
 [0.  0.  0.  0.  0.1]
 [0.  0.  0.  0.  0.5]
 [0.  0.  0.  0.  0.4]]

Going back to the formula for the derivative of the Softmax Layer:

\frac{d\textbf{S}}{d\textbf{W}} = \frac{d\textbf{S}}{d\textbf{Z}} \cdot \frac{d\textbf{Z}}{d\textbf{W}}

We now just take the dot product of both of the derivative matrices to get the derivative for the whole layer:

DL = np.dot(DS, np.transpose(DZ))
print(DL)

[[ 0.01544  0.07723  0.06178 -0.00388 -0.01942 -0.01554
  -0.00414 -0.02071 -0.01657 -0.00441 -0.02208 -0.01766
  -0.00300 -0.01501 -0.01200]
 [-0.00388 -0.01942 -0.01554  0.01621  0.0810   0.06484
  -0.00441 -0.02208 -0.01766 -0.00470 -0.02354 -0.01883
  -0.00320 -0.01600 -0.01280]
 [-0.00414 -0.02071 -0.01657 -0.00441 -0.02208 -0.01766
   0.01699  0.08495  0.06796 -0.00501 -0.02509 -0.02007
  -0.00341 -0.01706 -0.01364]
 [-0.00441 -0.02208 -0.01766 -0.00470 -0.02354 -0.01883
  -0.00501 -0.02509 -0.02007  0.01778  0.08890  0.07112
  -0.00363 -0.01818 -0.01455]
 [-0.00300 -0.01501 -0.01200 -0.00320 -0.01600 -0.01280
  -0.00341 -0.01706 -0.01364 -0.00363 -0.01818 -0.01455
   0.01325  0.06626  0.05300]]

Shortcut!

While it is instructive to see the matrices being derived explicitly, it is possible to manipulate the formulas to make it easier. Starting with one of the entries in the matrix DL, it looks like this:

\frac{\delta{s_{t}}}{\delta{w_{ij}}} = \sum_{k=1}^K D_{k}S_{t} \cdot D_{ij}Z_{k}

Since the matrix dZ/dW is mostly zeros, then we can try to simplify it. dZ/dW is non-zero when i = k, and then it is equal to xj as we worked out above. So we can simplify the non-zero entries to:

\frac{\delta{s_{t}}}{\delta{w_{ij}}} = D_{i}S_{t}x_{j}

In the previous post, we established that when the indices are the same, then:

D_{i}S_{j} = S_{j}(1-S_{i})

So:

\frac{\delta{s_{t}}}{\delta{w_{ij}}} = S_{t}(1-S_{i})x_{j}

When the indices are not the same, we use:

\frac{\delta{s_{t}}}{\delta{w_{ij}}} = S_{t}(0-S_{i})x_{j}

What these two formulas show is that it is possible to calculate each of the entries in the derivative matrix by using only the input values X and the Softmax output S, skipping the matrix dot product altogether.

Here is the Python code corresponding to that:

def l_dir_shortcut(W, S, x):
    dir_matrix = np.zeros((W.shape[0] * W.shape[1], W.shape[1]))
    
    for t in range(0, W.shape[1]):
        for i in range(0, W.shape[1]):
            for j in range(0, W.shape[0]):
                dir_matrix[(i*W.shape[0]) + j][t] = S[t] * ((i==t) - S[i]) * x[j]
                
    return dir_matrix

DL_shortcut = np.transpose(l_dir_shortcut(W, h, x))

To verify that, we can cross check it with the matrix we derived from first principle:

print(DL_shortcut)

[[ 0.01544  0.07723  0.06178 -0.00388 -0.01942 -0.01554
  -0.00414 -0.02071 -0.01657 -0.00441 -0.02208 -0.01766
  -0.00300 -0.01501 -0.01200]
 [-0.00388 -0.01942 -0.01554  0.01621  0.08105  0.06484
  -0.00441 -0.02208 -0.01766 -0.00470 -0.02354 -0.01883
  -0.00320 -0.01600 -0.01280]
 [-0.00414 -0.02071 -0.01657 -0.00441 -0.02208 -0.01766
   0.01699  0.08495  0.06796 -0.00501 -0.02509 -0.02007
  -0.00341 -0.01706 -0.01364]
 [-0.00441 -0.02208 -0.01766 -0.00470 -0.02354 -0.01883
  -0.00501 -0.02509 -0.02007  0.01778  0.08890  0.07112
  -0.00363 -0.01818 -0.01455]
 [-0.00300 -0.01501 -0.01200 -0.00320 -0.01600 -0.01280
  -0.00341 -0.01706 -0.01364 -0.00363 -0.01818 -0.01455
   0.01325  0.06626  0.05300]]

Lastly, it’s worth noting that in order to actually modify each of the weights, we need to sum up the individual adjustments in each of the corresponding columns.

Deep Learning Dead-End?

Deep Learning is at the core of much of modern Artificial Intelligence. It has had some spectacular recent successes, not least being a major part of the system that beat the world champion at Go.

Key to its success is the Back-Propagation algorithm, usually shortened to “Backprop”. I’ve written elsewhere about how this algorithm works, but essentially, it takes an error in the output of a neural network and propagates it backwards through the network, adjusting the network’s configuration as it goes to reduce that output error.

This algorithm has been so successful that deep learning neural networks are finding applications in a broad range of industries. Much of the recent popularisation of artificial intelligence and machine learning is due to this very success.

Now one of the longest proponents of this algorithm, Geoffrey Hinton from the University of Toronto has suggested that if progress is to be made on AI, then focus must shift away from Backprop. His view is based on the observation that the brain doesn’t learn that way and if intelligent machines are to be developed, new techniques are required.

In particular, he suggests that Unsupervised Learning will prove to be a fertile area. The method of learning does not rely on having fully labelled or classified datasets the way Supervised Learning and Backprop need. Instead it tries to understand patterns within the data itself to be able to make predictions and classifications.

Deep Learning does still have a lot to offer. However, given it’s requirements for large amounts of data and computing power, there is an increasing awareness that alternative machine learning techniques may prove to be equally fruitful.

Source: Artificial intelligence pioneer says we need to start over – Axios

Playing Go probably won’t lead to better AI

floorgoban
The traditional Chinese board game Go. (Wikipedia)

Go is a traditional Chinese game that is played by two players and involves placing stones on a board in order to capture the opponent’s stones.

Although the rules are quite simple, and there is perfect information, the strategies involved are quite complex. The very best software available today that plays this game is not able to beat professional players for many reasons, including the number of possible moves and the large size of the board (compared to chess).

Now Demis Hassabis, who was behind DeepMind (purchased by Google in 2014), has hinted that his team has managed to get a machine to play the board game Go. Previously, the team has demonstrated an AI learning to play old video games like Breakout. The algorithms have learned to play without help better than most humans, so this team knows a thing or two about designing algorithms to learn to play games.

I’m a little skeptical though about how much conquering Go will advance the field of AI. Back in the 1990s, much excitement and publicity was generated when IBM’s Deep Blue managed to beat the reigning world chess champion, Gary Kasparov. However, this feat was more down to processing power and Deep Blue’s ability to evaluate millions of positions per second than any real advance in machine intelligence.

Certainly Kasparov didn’t play that way and so Deep Blue didn’t really give any great insights into human intelligence. While it may be interesting, beating a human at Go may well turn out to be another example of Artificial Narrow Intelligence.

via Google DeepMind Founder Says AI Machines Have Beat Board Game Go | Re/code.

Go Board Game (Wikipedia)

Artificial Intelligence Mysticism

Life of Francis of Assisi by José Benlliure y Gil (Source Wikipedia)

Lots of recent writing on Artificial Intelligence is focused on the far off vista of human-level AI powered robots in everyday life. The main philosophical questions examine the age old human questions of sentience, autonomy, free will and self determination. We can now add spirituality to that list, strange as it may seem.

“…it stands to reason that AI will be able to teach us a thing or two about what it means to follow God.” Rev. Christopher Benek

On the face of it, this is rather strange to me. Today’s AIs are very mathematical and use well understood techniques (even if those techniques are sometimes surprisingly powerful but lacking theoretical understanding). So if eventually a human-level AI is created, we can be certain that we’ll be able to understand exactly what it is and how it works. But it won’t be following God.

This reminds me of a scene in the film Contact. Jodie Foster plays radio astronomer Eleanor (Ellie) Arroway, who discovers an encoded message being broadcast from an alien civilization in deep space. Invited to a briefing in the White House by Rachel Constantine (Angela Bassett) to discuss this, she is very surprised by the opinions of Richard Rank, head of a conservative Christian organisation (played by Rob Lowe). At that point in the movie, the message itself consisted of a series of prime numbers accompanied by a large number of pages of engineering schematics. Their dialogue goes like this:

Rank: “My problem is this. The content of the message is morally ambiguous at best…”

Arroway: “This is nuts.”

Rank (forcefully): “Excuse me, Miss. We know nothing of these creatures’ values. The fact of the matter is we don’t even know if they believe in God.“

Arroway: “This doesn’t make any sense. If you were to ask…”

Constantine: “Excuse me Dr. Arroway. We won’t be suppressing any opinions here today.”

Although correct to point out that different people’s opinions should not be suppressed, it may also be the case that not all opinions have equal merit. This is particularly true when it comes to interpreting a set of mathematical equations, engineering schematics or algorithms.

The scientist Arroway and the religious Rank have such completely different perspectives and understanding of the same thing, they can’t even communicate properly.

But to state that an AI composed of algorithms would “participate in the process of discipleship and spiritual formation that is inherent to Christ’s redemptive purposes” – well, to quote Arroway: This doesn’t make any sense.

Source: Artificial Intelligence Will One Day Lead People to New Levels of Holiness.

Do Computers Think?

“Cogito, ergo sum (I am thinking, therefore I exist)”, as Rene Descartes famously proposed in 1637, has spawned almost four hundred years of philosophical debate on the nature of thinking and existing.

In this argument, he proposed that the only thing that he was absolutely certain about is that he exists, as he is here to think about existence. This is quite an abstract thought process so when we see the quote below, it naturally suggests computers are capable of similar philosophical musings.

Computers are learning to think, read, and write, says Bloomberg Beta investor Shivon Zilis.

via How Machine Learning Is Eating the Software World.

There have been many debates on the nature of thinking, especially over the last 50 years or so of the computer age. Most famous perhaps is the Chinese Room thought experiment proposed by the philosopher John Searle. His argument proposes that he is locked in a room. He does not speak or read any Chinese and only has a set of instructions which outline what Chinese symbols he is to respond with if he receives a set of Chinese symbols.

From outside the room, if we pass in a correct Chinese sentence or question to John, we will receive a correct response, even though John doesn’t speak Chinese and the instruction book certainly doesn’t either. We are led to deduce (erroneously) that there is a Chinese speaker in the room. (You can find out about his argument and some of the counter-arguments here on Wikipedia.)

Some of the achievements in Machine Learning are indeed impressive. But all such algorithms are the same as the Chinese Room. There is an actor (in this case the computer) carrying out a set of pre-defined instructions. Those instructions are complex and often achieve surprising results. But at no point can we safely deduce that the computer is actually thinking. We may say that today, computers do not think in the way that humans do and that the above quote is a bit of an exaggeration.

As the volume of articles written about Machine Learning and Artificial Intelligence grows, we have to be careful not to unduly overstate the capabilities of these algorithms. We need to avoid the mistakes of the past where much was promised for AI and little delivered, to preserve the interest and funding for research.

Impressive? Yes. Interesting? Definitely. Thinking? No.

The AI Threat: It’s All About Jobs

Google Self Driving Car – Disrupting Transportation and Logistics Industries (Photograph: Justin Sullivan/Getty Images)

This article in the Guardian Newspaper by John Naughton is a lot less sensationalistic than some recent existential scaremongering. Nevertheless, the underlying argument is just as threatening:

but there’s little doubt that the main thrust of the research is accurate: lots of non-routine, cognitive, white-collar as well as blue-collar jobs are going to be eliminated in the next two decades and we need to be planning for that contingency now.

However, the author is not optimistic about that planning taking place for two reasons, one related to our political short-termism, which ignores anything that has a horizon longer than the next general election, the other related to our innate incapacity for dealing with change.

There are other reasons too. The popular concept of AI is still rooted in science fiction (perhaps due to Hollywood movies). This means that any discussion around it’s impact on day-to-day life may be met with a slight incredulity. Only when AI is everywhere will realization dawn on people that planning is needed.

Another reason for not focusing on planning for change is simple economics. If a corporation can replace a worker with an Artificial Intelligence that can operate around the clock, then it is compelled to do that to grow it’s profits.

In any event, commerce will ensure that the current pace of development of AI and Machine Learning will continue and accelerate. The time left for planning is short.

We are ignoring the new machine age at our peril | Comment is free | The Guardian.

Turing Test Contest Details

Alan Turing (Image Public Domain)

The recent movie The Imitation Game, starring Benedict Cumberbatch, brought the work of Alan Turing to a much wider audience than was previously the case.

The movie has an interesting scene where Alan discusses the concept of an intelligent machine with the policeman who arrested him. He asks if you would consider a machine to be intelligent if a human couldn’t tell the difference between it and another human when conversing with it.

He published this idea in a paper in 1950 and he called the scenario The Imitation Game. Later this became known as the Turing Test.

Every year, a competition is held to test real world Artificial Intelligence algorithms to see if they can pass the Turing Test. This competition is called the Loebner Prize. Since the competition started in 1991, no algorithm has managed to pass the test.

This year, the competition will be held at Bletchley Park, where Alan Turing worked on breaking the German Enigma Code. The deadline for applications is 1st July 2015 and the final will be held on 19th September.

You can read Turing’s original paper proposing the test here:

Computing Machinery And Intelligence by A.M.Turing

The details of the Loebner Prize are here:

AISB – The Society for the Study of Artificial Intelligence and Simulation of Behaviour – Loebner Prize.